
A quick recap: In our last post, we shared how we developed a measurement system that tracked the journey of every work item through every step of our delivery process. For the first time, we could look at any team's delivery board and actually see what was happening, not what we assumed was happening. We had a factual baseline. Now we had to decide what to do with it.
What we started measuring, religiously
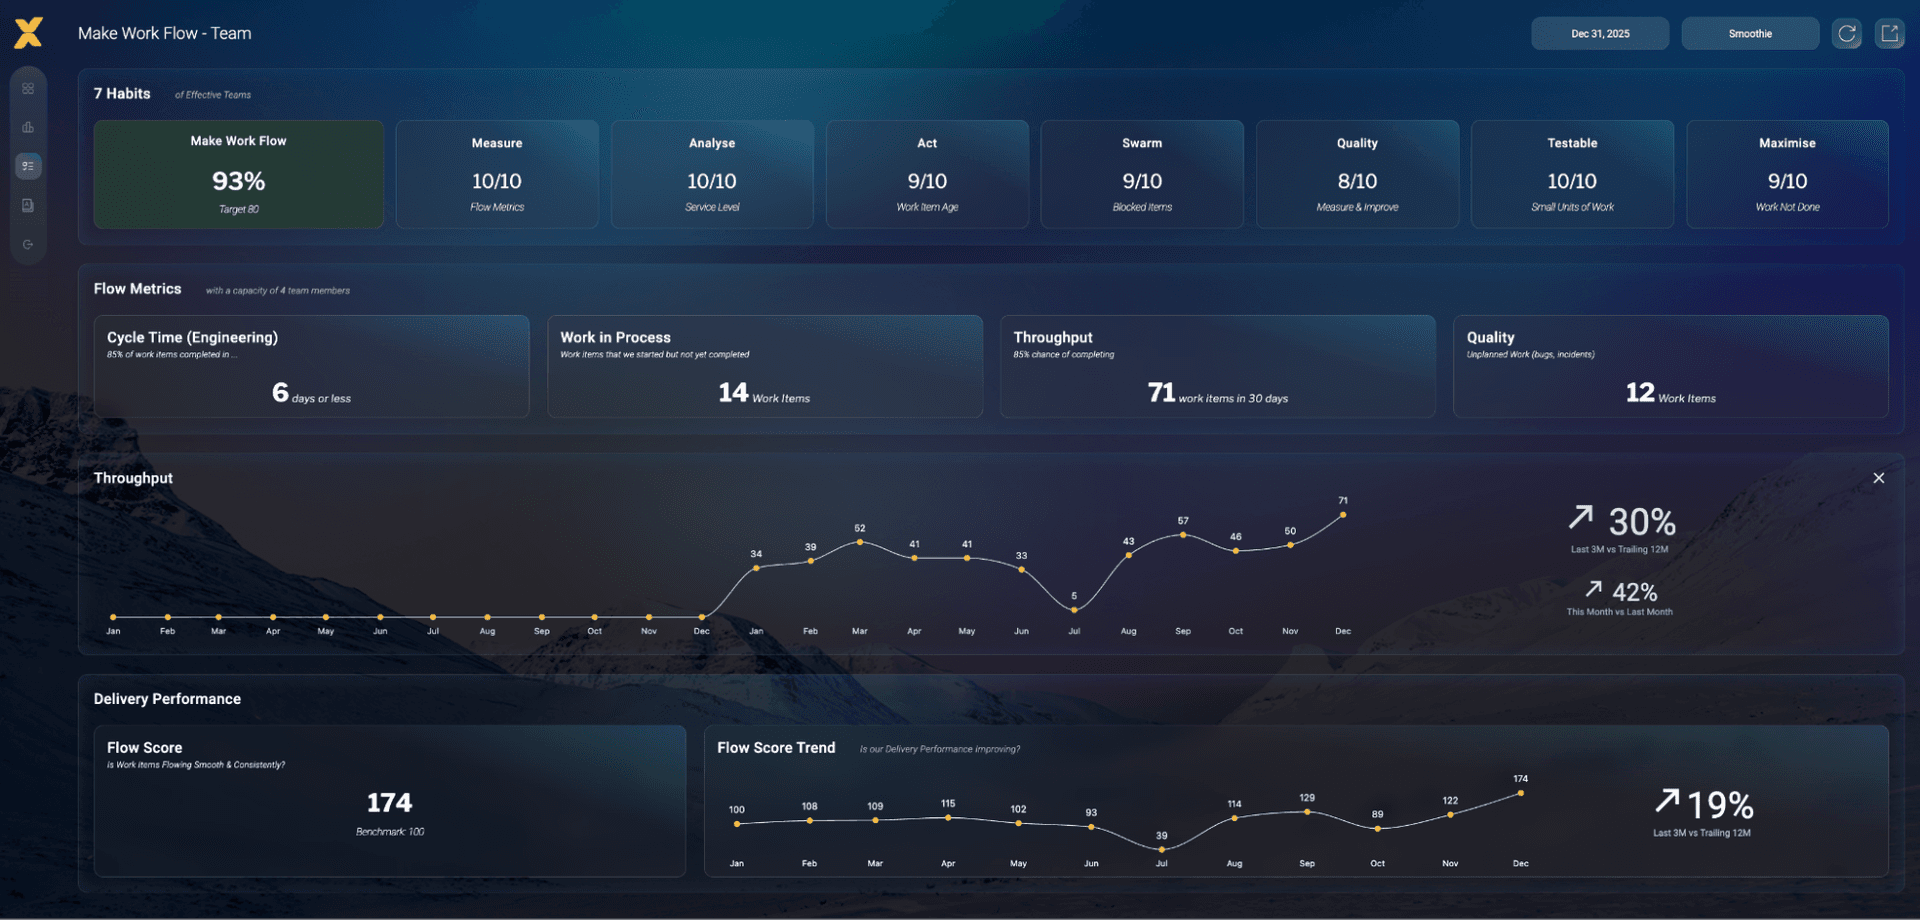
Once the system was in place, we landed on four core metrics that we tracked consistently across every team:
Cycle Time: The full time a work item takes from the moment someone picks it up to the moment it is deployed to production, including every delay and waiting period along the way, measured at each step of the delivery process.
Work in Progress (WIP): Every task that has been started but not yet finished. Not just what sits in the "In Progress" column, but everything that hasn't been released yet.
Throughput: The number of tasks completed within a given period. A straightforward measure of how much value has actually been deployed to production.
Quality: Measured as the defects and incidents that pull teams away from working on new features. Not quality as a feeling, but quality as an interruption to flow.
From these four, we developed something we call the Flow Score, which is our own composite metric that combines all of the above, with quality carrying the significantly highest weight to support our quality-first mindset. It gives us a single, honest signal: Are we improving the flow of value through our delivery process, or not?
But metrics alone aren't enough
Here's the thing we had to keep reminding ourselves: It's not about tracking metrics for the sake of it.
The numbers are only useful if they help us see something; specifically, where teams are struggling with healthy delivery habits. The goal was never a better dashboard; it was better delivery: stronger engineering practices, work that flows more smoothly, and teams that consistently deliver more value.
The metrics were the diagnostic. The habits were the cure.
Introducing the seven habits of successful delivery
Based on everything the data was showing us, we identified seven specific behaviors and habits that separated teams with healthy delivery flow from those that were quietly struggling. We called them the seven habits of successful delivery, and we began evaluating every team against them on a monthly basis.
When you read them, your first reaction will probably be: but these are basics; surely everyone is already doing this.
That reaction is exactly the point. These habits make complete sense in theory. The reality is that under pressure, in busy teams, with competing priorities, they slip. Quickly and quietly. Good habits are fragile. Bad habits are sticky.
And our data showed us precisely where the slippage was happening.
Here they are:
Habit 1 — Measure: Use the flow metrics regularly. Make them visible. Let data replace speculation in how teams understand their own delivery process.
Habit 2 — Analyze: Establish a Service Level Expectation based on your team's own flow data. Understand what "typical" looks like for your team and use that baseline to spot when something is taking longer than it should.
Habit 3 — Act: Every day, look at work item age against your Service Level Expectation. Focus on what is taking longer than usual. This habit also quietly transformed how our daily standups worked; if something is moving as predicted, does it really need to be discussed?
Habit 4 — Swarm: When work is stuck, don't leave it sitting in a blocked column. Work together to unblock it, through pair programming, mobbing, or escalating outside the team. Stop Starting, Start Finishing what you started.
Habit 5 — Quality: Define what quality actually means for your team, measure it consistently, and act on it proactively. When we dug into this with teams, we found that most believed they were measuring quality but the definition, the tracking, and the follow-through varied enormously.
Habit 6 — Testable: Break work down into small, testable units of value. Vertical slicing. It sounds straightforward but it is anything but that. This habit requires real investment in training and a fundamental shift in how teams think about backlog items.
Habit 7 — Minimize: Deliver only what is needed to bring value to the client. Ask, every time: what is the least amount of work required to achieve the goal? Avoid the pull toward over-engineering, unnecessary documentation, and features that don't enhance the end user experience. As Kent Beck put it: if simplicity is good, always leave the system with the simplest design that supports its current functionality.
What comes next
In the next post, we'll go deeper, sharing real examples of what the data showed, the conversations we had with teams to improve delivery habits, and what actually started to change when we put these habits at the centre of how we work.