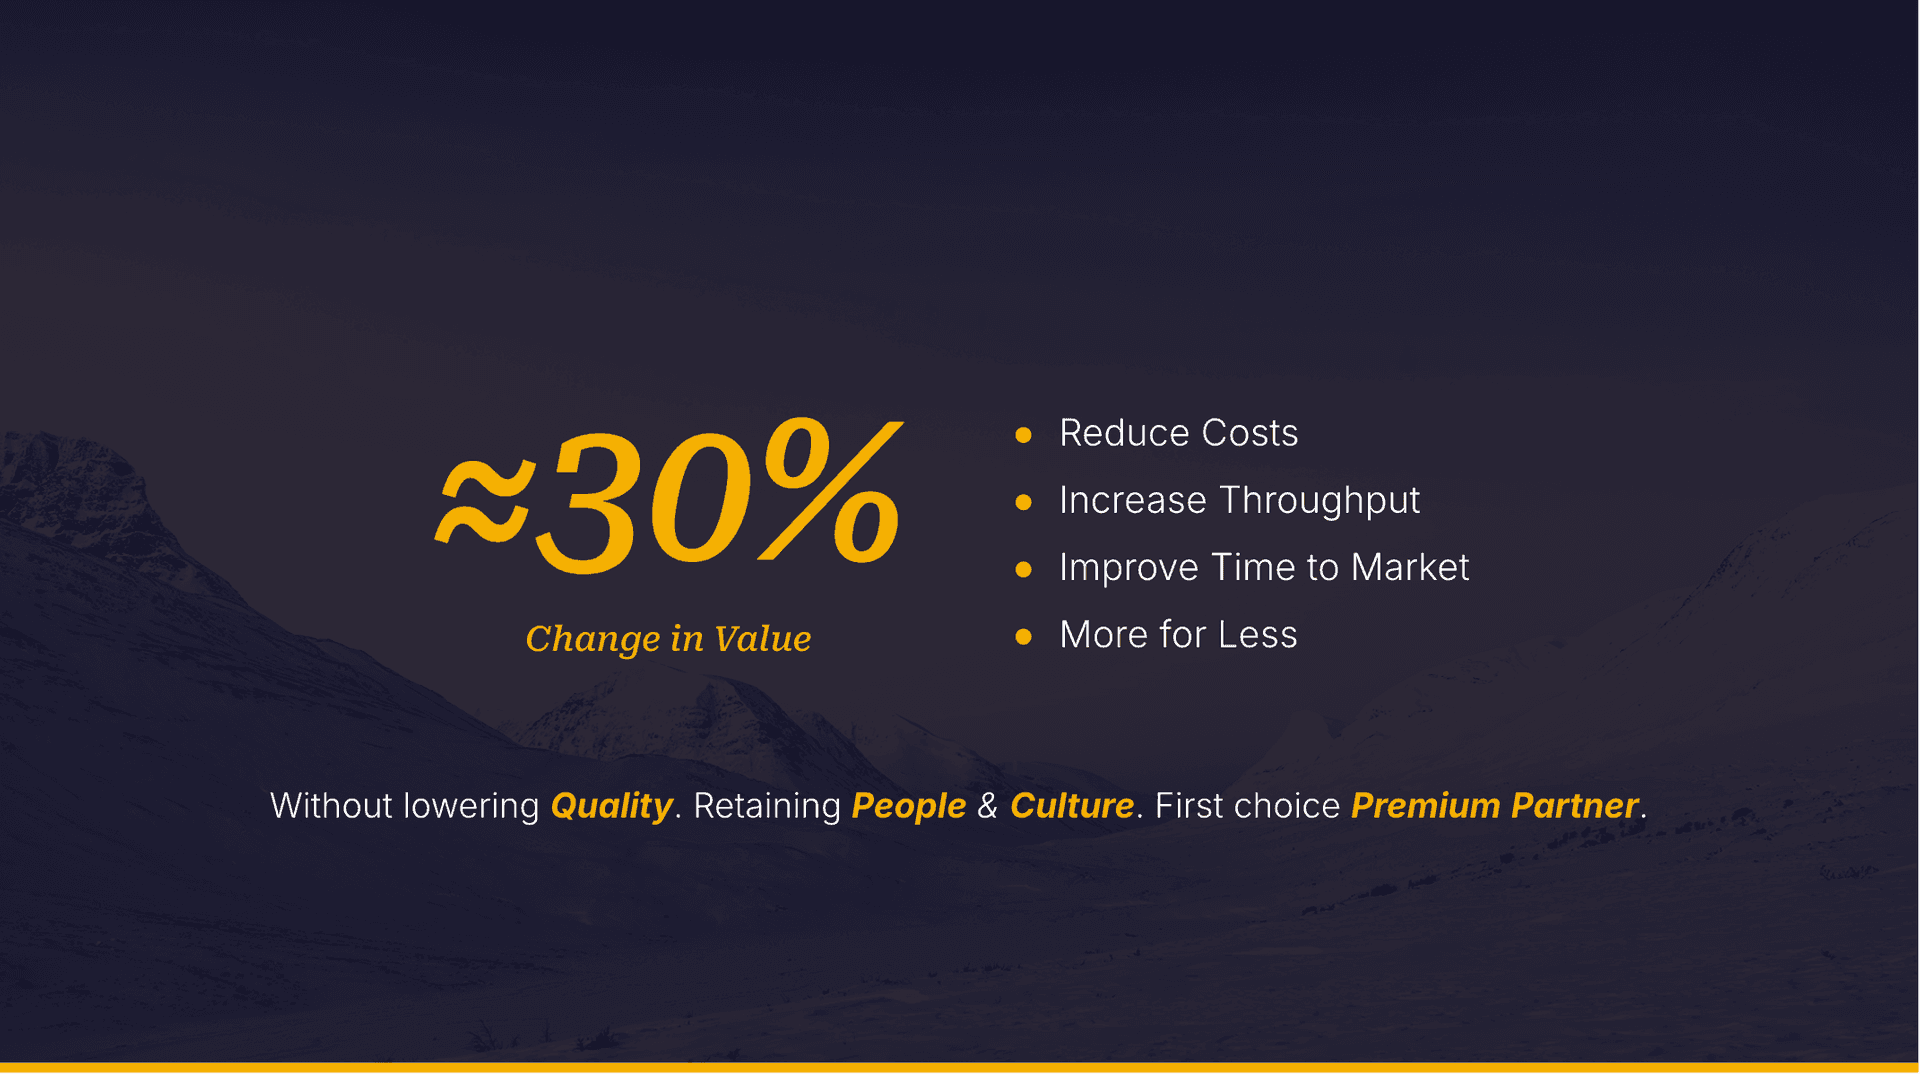
≈30% change in value. Guaranteed.
In our last post, we shared how
Sticky habits and improving flow metrics → transformed the way our teams work
The daily standup → became a focused act of unblocking
Stop Starting and Start Finishing → reduced WIP and lifted throughput
Three recurring patterns of delay → were tackled directly through the 7 Habits of Successful Delivery.
The habits were holding and the numbers were moving. And that consistency opened a door that we anticipated.
18 months of work behind the scenes. One bold outcome.
Over the last 18 months, we have been quietly and deliberately modernising how we deliver. Not with a rebrand. Not with a new slide deck. With data, habits, technology and an honest reckoning with where our delivery process was letting us, and our clients, down.
The result is a proven model. One we are now confident enough to put in a contract.
We can commit to a ≈30% change in value for our clients - without lowering quality, without burning out our teams and without a single extra hour billed for the sake of it.
That change in value comes from a couple of things working together:
Reducing total cost of ownership
Increasing throughput (delivering more value)
Improving time to market
And doing all of it while retaining the people, the culture and the premium delivery standard our clients expect.
Here is how we got there.
The foundation: four pillars, eighteen months, one direction
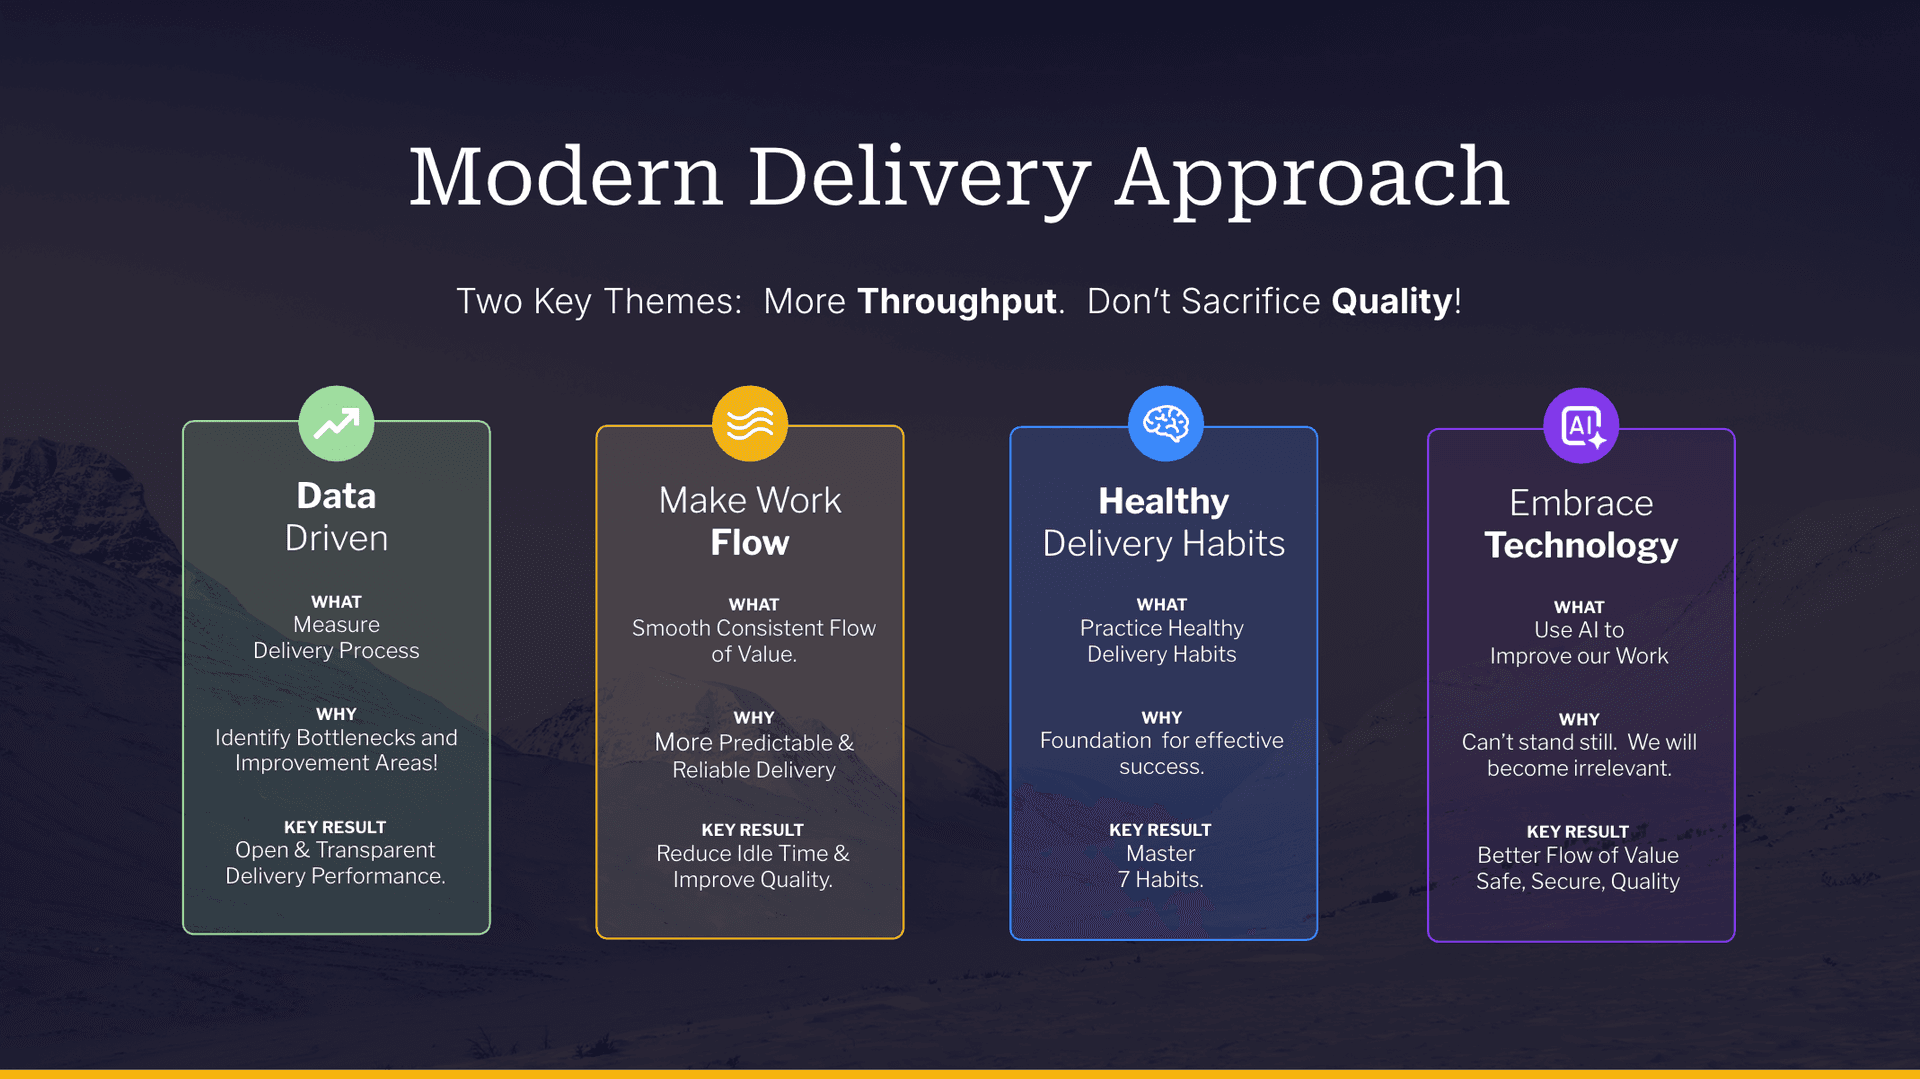
1. Being Data Driven. For the first time, we had transparent and normalised delivery performance metrics across the business. Not to monitor people, but to find where work was getting stuck and more importantly why.
2. Making Work Flow. We relentlessly pursued the reduction of idle time. The goal was simple: work should move smoothly and consistently through the delivery process. When it didn't, we wanted to know exactly where it stopped and what caused it to stop.
3. Practising Healthy Delivery Habits. Data without behaviour change is just a dashboard. The 7 Habits of Successful Delivery; Measure, Analyse, Act, Swarm, Quality, Testable and Maximise became the operating rhythm of our teams.
4. Embracing Technology. Where work was getting stuck, we asked a harder question: can Technology or AI help us move faster here? With higher quality and more security?
Together, these four pillars represent our Modern Delivery Approach. Two themes running through all of it: More Throughput. Don't Sacrifice Quality.
From gut feel to forecast: how we changed the way we estimate
One of the most significant and at the same time least expected outcomes of this journey was what it did to our ability to plan.
Traditional estimation in software delivery is slow, expensive and surprisingly inaccurate. It requires many people and produces a number that is really a confident-sounding guess that turns out most of the time wrong. We've all been in those rooms.
We’ve now left that room →
By using each team's actual, current performance data, we can now answer two of the most important questions in any engagement in minutes, not days.
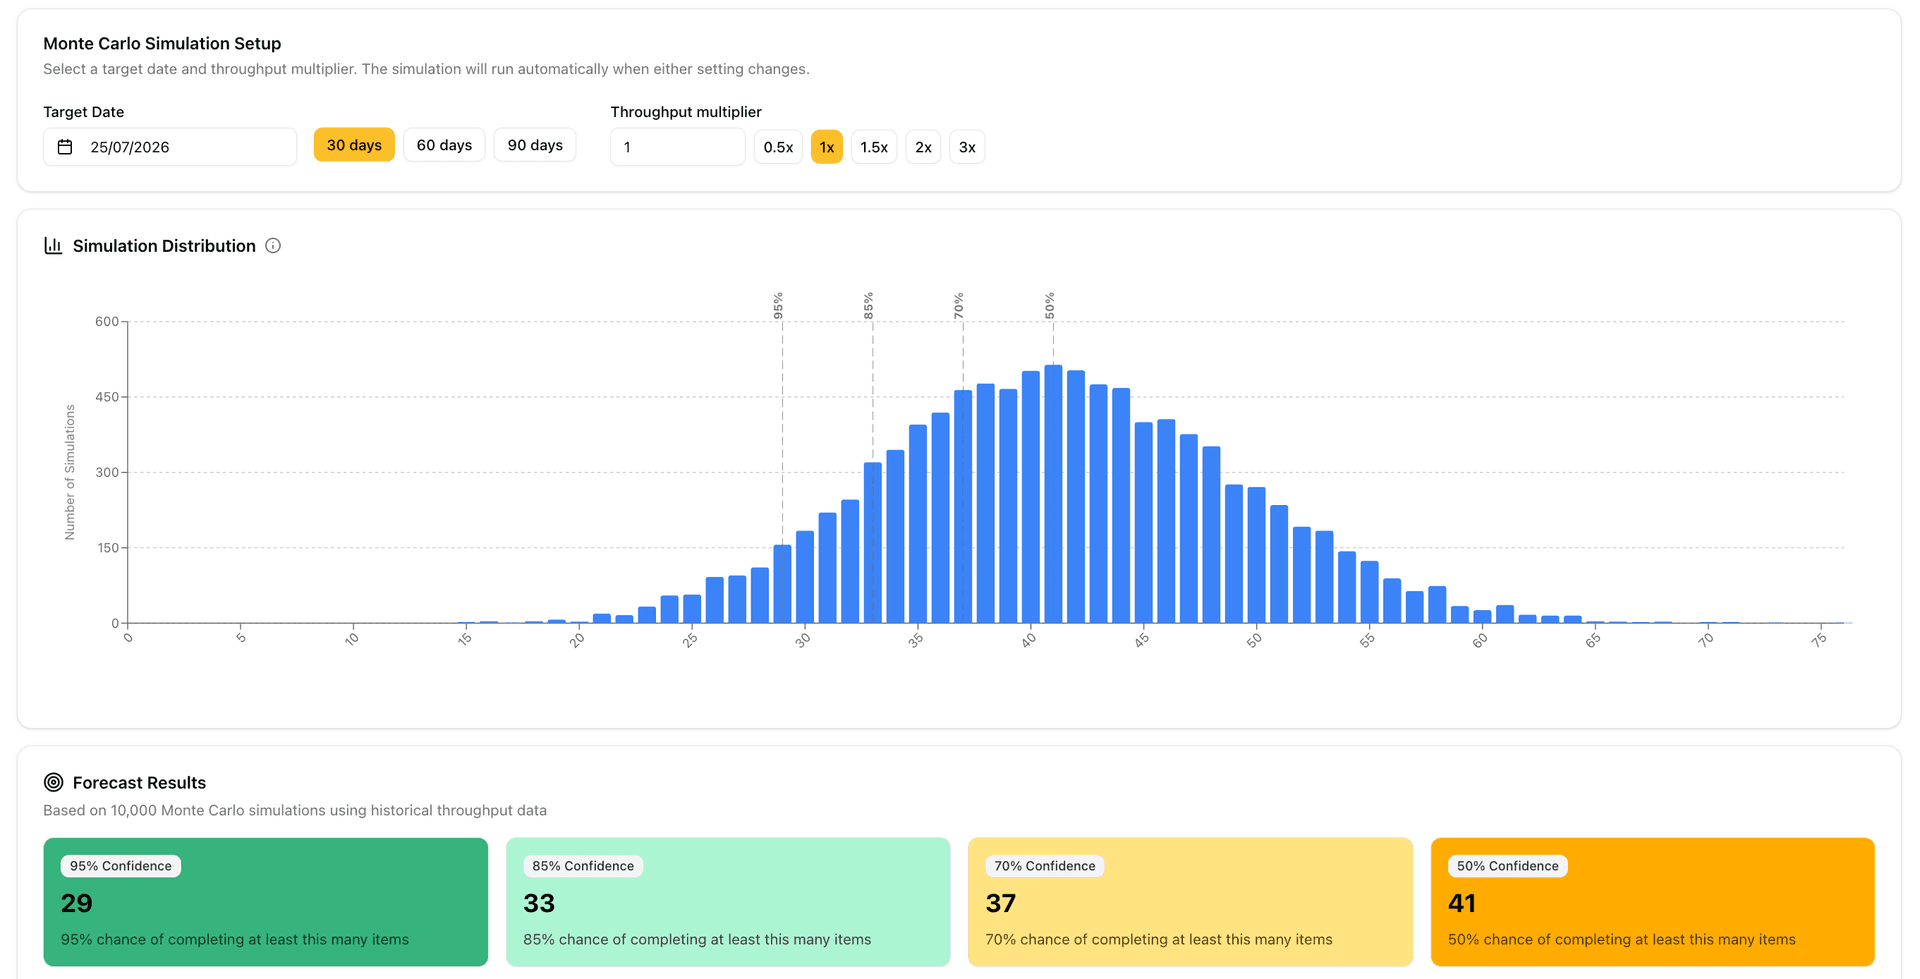
How many items will we complete by a specific date?
We start by setting a target date, a milestone, a go-live, a board deadline. Our system runs 10,000 Monte Carlo simulations based on a specific team's real performance metric history and returns a forecast at multiple confidence levels: 95%, 85%, 70%, 50%. The client can see exactly how much of their current backlog fits into the available time and make scope decisions based on data, not hope.
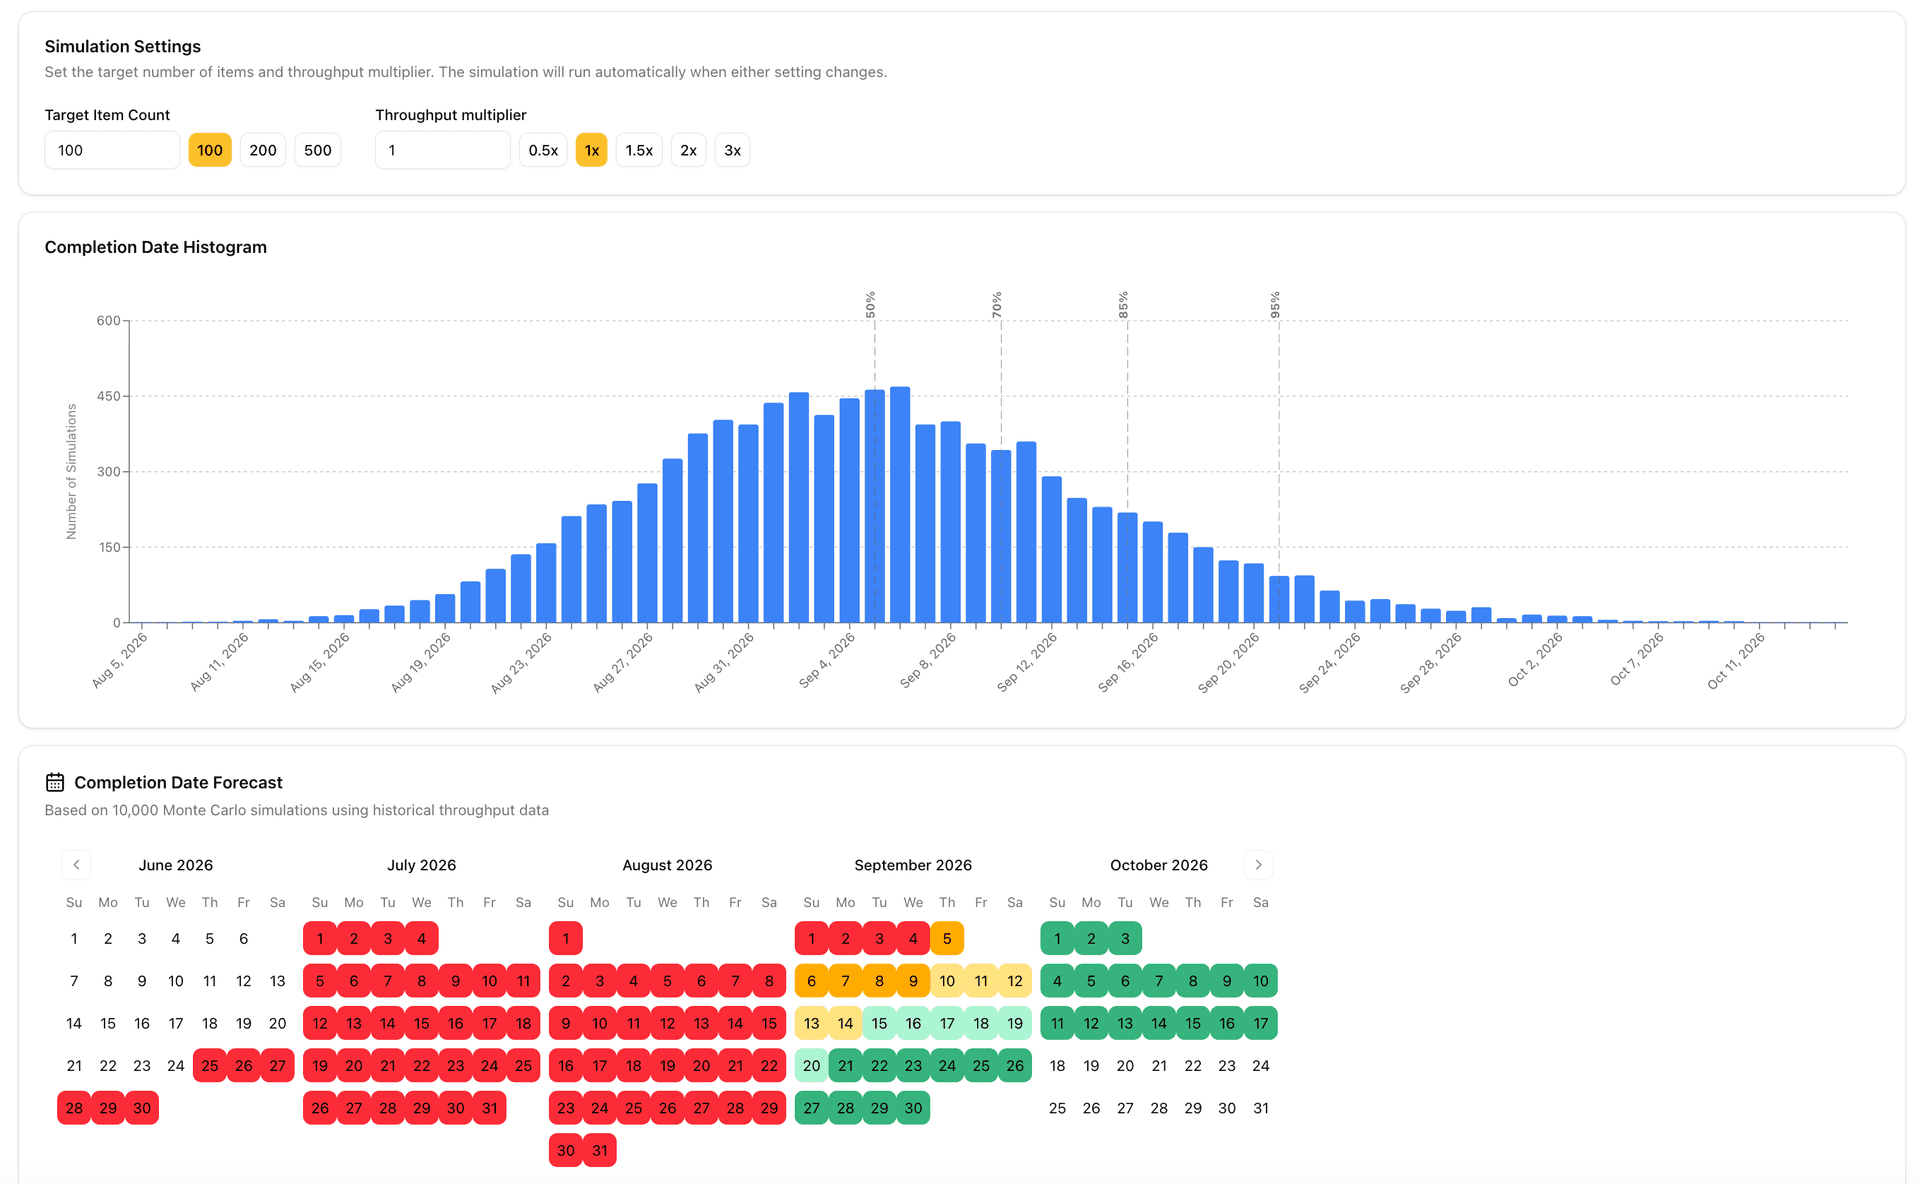
By when will a specific number of items be done?
We start by setting a target work item count (the non-negotiable backlog/scope). The simulation returns a completion date forecast at the same confidence levels, mapped onto a calendar. Green dates. Amber dates. Red dates. No ambiguity. No padding hidden in the estimate.
This changes the client conversation completely. Scope discussions become factual. Milestone planning becomes honest. And when something changes, a new priority, a team capacity shift, we rerun the simulation and show the updated picture immediately.
The gut feel is gone. The data is in.
The numbers that made the guarantee possible
Across the last 18 months, the direction has been consistent.
Most of our teams have seen at least a 30% uplift in throughput. Several have seen increases of up to 100%, delivering twice as much value in the same period without a corresponding hit to quality. In many cases, quality improved alongside it.
That is not a projection. That is what the data shows.
When you combine that throughput improvement with reduced idle time, better forecasting accuracy and a team practising healthy delivery habits consistently, the confidence to make a contractual commitment stops feeling bold. It feels overdue.
Proving the impact of AI for real, not in theory
For some time now, the question around AI in delivery has been: it brings value yes, but how do you actually measure how much and whether it's working?
We can now answer that question.
Every team already has a Flow Score, our composite metric combining Cycle Time, WIP, Throughput and Quality, weighted toward quality. It is our single measure of how effectively value is flowing through a team's delivery process.
Every team also now has an AI usage score, calculated based on how each team member is actively using AI tools within their workflow.
When we overlay these two signals, something becomes visible that was previously invisible: the relationship between AI adoption and the flow of value.
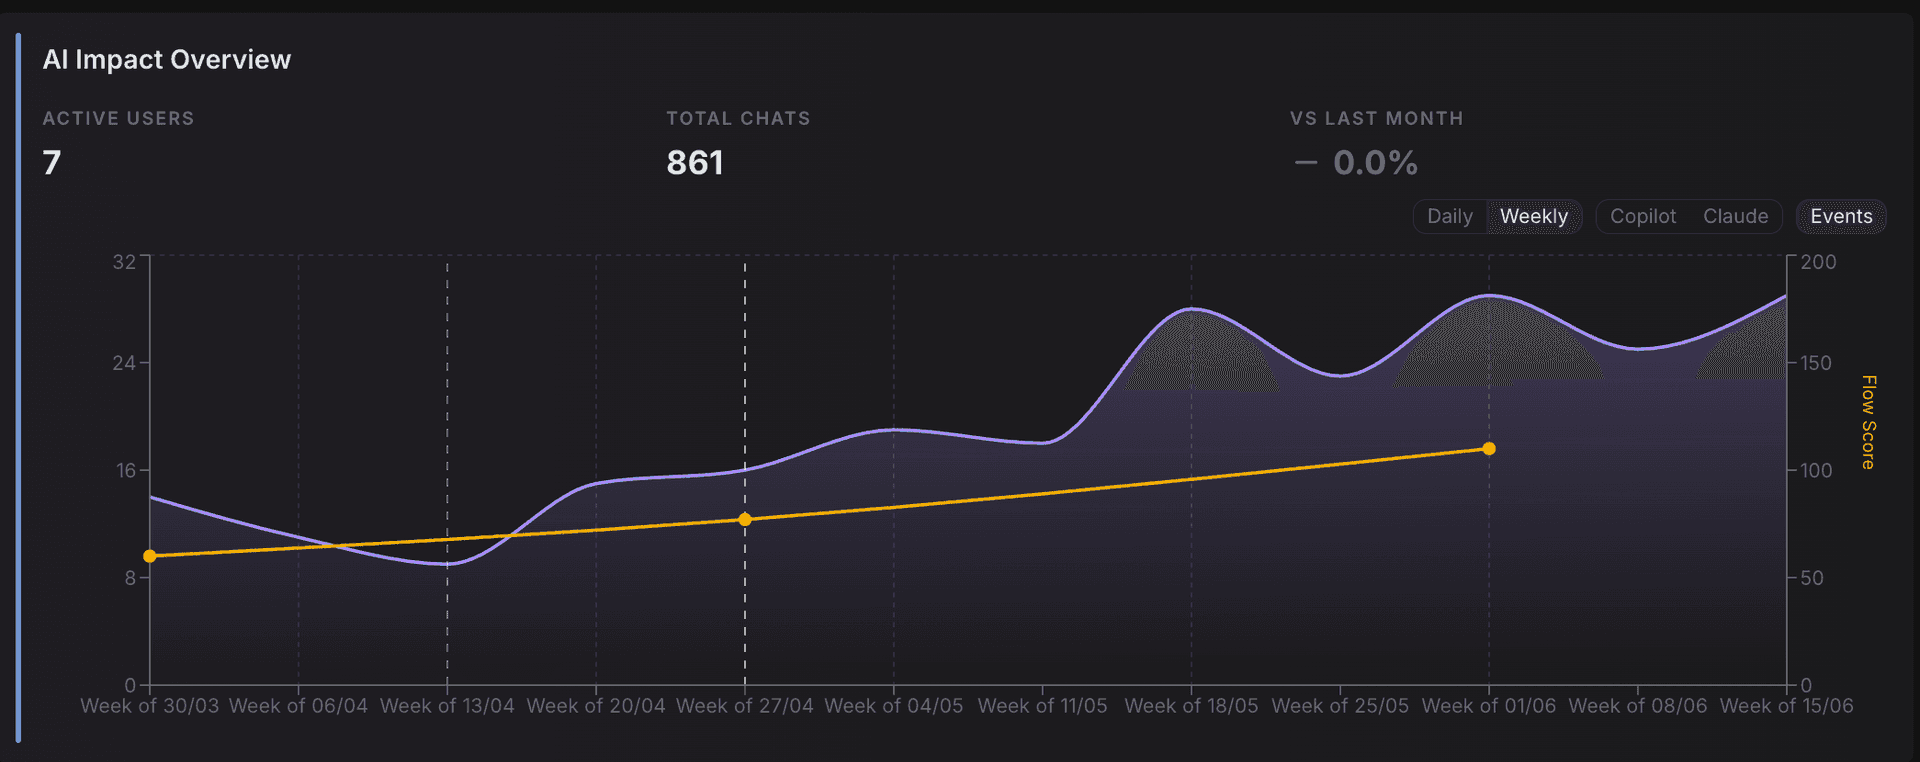
Are teams that embrace AI delivering more throughput? Is quality holding? Is the Flow Score moving in the right direction as AI usage increases? The chart tells the story transparently in every monthly review and quarterly business review with our clients.
This is not a vendor claim about AI productivity. It is a team-level, client-visible measurement of whether the technology investment is actually compounding into value. For clients, that transparency is rare. For us, it is now standard.
What this has meant in practice
This model is not a pilot. It is receiving strong validation, from new clients choosing Vaimo on the strength of this approach, and from existing clients who have renewed and deepened their contracts based on what the data has shown them over time.
The journey has been one of the most significant in our company's history. Not because we changed our pricing model. Because we earned the right to.
What comes next
In the next post we will share a real client case study of what the engagement looked like before, how the contract changed and what the data showed over time.